


Real-life resin price forecasting via machine learning/AI

Against the back of volatility of global resin prices, primarily due to Covid-19-induced factors as well as feedstock and upstream commodity prices, a question remains as to why existing price forecasts tend to be relatively linear despite historical price instability. Thus, newly set-up research firm MLT Analytics decided to look at rational means of introducing the volatility observed in historical data into resin price forecasting.
The Singapore-based firm is looking at a two-fold approach: first to develop a series of hypothetical feedstock price scenarios based on mega-trends, such as peak oil, vehicle electrification, natural gas-fired electricity proliferation, and regulatory developments. Then, to use machine learning and artificial intelligence to pinpoint the key influencers of resin pricing. Once identified, these influencers can be correlated with historical prices to generate real-world forecasts.
“Long-term oil and gas price forecasts, from the US Energy Information Administration, for example, lack volatility. They rise or fall, depending on the scenario, in a relatively linear fashion. What we are doing is introducing volatility into our forecasts based on past feedstock trends and assumptions of future market developments such as peak oil that, in turn, introduces volatility into the resin price forecasts,” says Stephen Moore, Co-Founder/CEO of MLT Analytics. “We analyze multiple feedstock and use machine learning to explore their correlations with resins by type and region or country where they are sold.”
While plastics are the starting point for MLT Analytics, pricing for any type of commodity, including non-plastic materials, theoretically can be forecast once historical prices are correlated with data for key influencers.
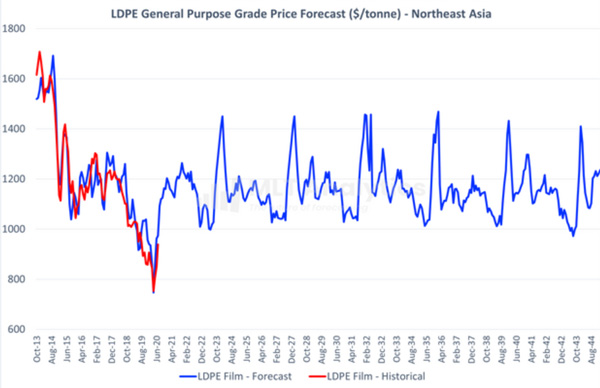
Once the forecasting model has been set up, the latest historical data is fed into the model as it becomes available, which serves to further refine the forecast. Further, “back-casting,” as indicated in the graphic by the portion of the blue line overlapping the red historical line, is a means of verifying the validity of the forecast. A close overlap of the historical and back-casted data is proof that the modeling is working from a statistical perspective.
Moore also cautions, “Unless the data you are feeding into the forecasting model makes sense from industry and economic perspectives, your forecast will, unfortunately, look like an unlikely outcome.”
He furthers, “That’s where the decades of industry expertise our team has accumulated becomes of ultimate importance.”
For further information, please visit the website: www.mltanalytics.com