


Six new records set by LNG industry in 2019
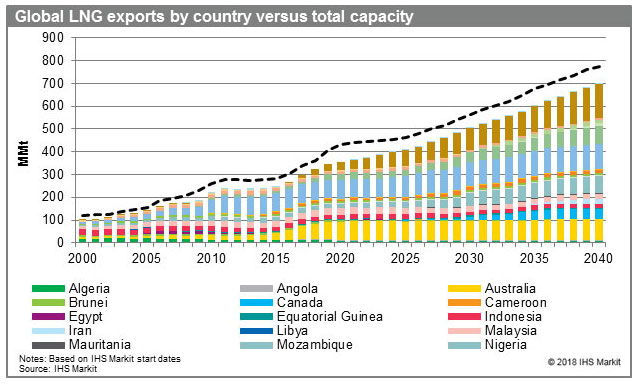
The year 2019 was a record-shattering year for the liquified natural gas (LNG) industry, says a new report by research company IHS Markit. The report, titled 2019: A Year of Records for LNG says that the numerous records are indicative of a sustained growth trend, with global LNG capacity expected to increase by more than 50%: from 283 million metric tonne per annum (MMtpa) in 2015 to 437 MMtpa in 2020.
“The ongoing pace of new investment is especially noteworthy considering a market context of weak global prices,” said Michael Stoppard, chief strategist, global gas at IHS Markit. “Not only did LNG grow at an unprecedented rate in 2019, but the industry also laid the foundations for continued strong growth into the middle of the decade.”
Key records set by the LNG industry in 2019 were:
- Record levels of new investment. Final investment decisions (FIDs) for liquefaction projects were made at an extraordinary level of 70.4 million tons per year (MMtpa)—40% higher than the previous all-time high reached in 2005 (50.4 MMtpa). The United States, Russia, and Mozambique each set individual highs for levels of annual FIDs.
- Record levels of FIDs without long-term contracts. Some liquefaction FIDs were made either without long-term contracts or were underpinned by sales to affiliates. Such “affiliate marketing” reached a record 43 MMtpa. Affiliate marketing at this scale has not been common in the LNG industry. Historically, most projects have instead secured long-term offtake contracts prior to committing to investment. By choosing to proceed without third-party contracts, projects can be developed more rapidly.
- Record liquefaction project start-ups. New liquefaction start-ups amounted to 38.8 MMtpa of capacity, narrowly surpassing the previous high set in 2009. Recent start-ups were concentrated in the United States, Australia and Russia. The pace of project starts is expected to slow in 2020 to 28.6 MMtpa of capacity. The United States will continue to dominate in this area as it mostly completes its current wave of projects.
- New global supply leader. Australia surpassed Qatar as the top LNG exporter for 2019, reaching 80.2 MMt relative to 72.5 MMt in 2018. Australia is expected to extend its lead in 2020 and retain its position as top exporter until 2023 when the United States is projected to become the largest LNG producer.
- Record European imports. Europe set records for imports each single month as well as for the year as whole. Annual net imports totaled 87.2 MM tons which exceeded the previous record of 65.5 MM tons set in 2011. Imports are expected to remain strong in 2020 due to additional new liquefaction supply coming to market. New supply in 2020 is expected to outpace Asian demand growth and therefore maintain sales into Europe.
- Record Chinese imports. China overtook Japan as the world largest LNG importer in the month of December 2019, with volumes for the month reaching 7.3 MMt, compared to Japan’s 6.9 MMt. Even though Japan is expected to continue to be the world’s largest LNG importer on a total annual basis through 2022, 2019 marked the second year in a row of declining imports for the country, continuing an overall downward trend since 2015. China entered its fourth year in a row of record LNG imports, increasing its LNG imports 13.4% on a year-over-year basis.
Additional Reference: IHS Markit 2019 LNG Trade Figures
LNG supply in 2019 totalled 373.0 million tons (MMt), up 11.8% from 2018 or 39.5 MMt. The largest increases in LNG exports came from the United States (37.7 MMt total, up 15.2 MMt), Russia (30.2 MMt total, up 10.1 MMt) and Australia (80.2 total, up 7.7 MMt).¹
Net LNG imports reached 358.8 MMt in 2019, up 40.5 MMt from 2018. Regionally, LNG imports² grew the most into Europe, totaling 87.2 MMt relative to 49.9 MMt in 2018. For individual countries, the United Kingdom registered the largest growth (13.3 MMt total, up 8.1 MMt), followed by France (16.3 MMt total, up 7.8 MMt), and China (62.4 MMt total, up 7.4 MMt).
Japan remained the largest LNG importer, receiving 77.5 MMt in 2019. However, this was a decline from 83.2 MMt in 2018, making Japan the market with the largest decrease in LNG imports in 2019. China remained the second largest importer OVER THE ENTIRE YEAR. South Korea remained the third largest importer in 2019, with 41.0 MMtons, however it also had the second largest decline relative to 2018 (down 3.5 MMtons).
For more information about the report 2019: A Year of Records for LNG or about IHS Markit LNG research services, visit https://ihsmarkit.com/products/LNG-market-outlook-demand-forecast.html.