


Oil factsheet
Oil is changing. Conventional oil resources are dwindling as tight oil, oil sands, heavy oils, and others emerge. Technological advances mean that these unconventional hydrocarbon deposits in once-unreachable areas are now viable resources. Meanwhile, scientific evidence is mounting that climate change is occurring, but the climate impacts of these new oils are not well understood. The Carnegie Endowment’s Energy and Climate Program, Stanford University, and the University of Calgary have developed a first-of-its-kind Oil-Climate Index (OCI) to compare these resources.
All Oils Are Not Created Equal
- Thirty global test oils were modeled during Phase 1 of the index.
- Greenhouse gas (GHG) emissions were analyzed throughout the entire oil supply chain—oil extraction, crude transport, refining, marketing, and product combustion and end use.
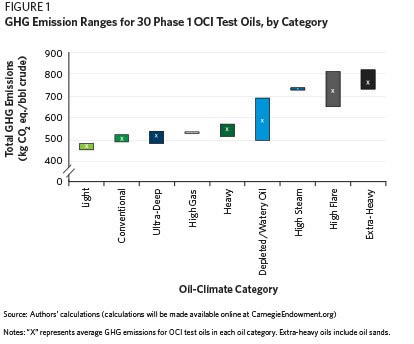
- There is an over 80 % difference in total GHG emissions per barrel of the lowest GHG-emitting Phase 1 oil and the highest.
- Climate impacts vary whether crudes are measured based on their volumes, their products’ monetary values, or their products’ energy delivered.
- The GHG emission spread between oils is expected to grow as new, unconventional oils are identified.
- Each barrel of oil produces a variety of marketable products. Some are used to fuel cars and trucks, while others—such as petcoke and fuel oils—flow to different sectors. Developing policies that account for leakage of GHG emissions into all sectors is critical.
- The variations in oils’ climate impacts are not sufficiently factored into policymaking or priced into the market value of crudes or their petroleum products.
- As competition among new oils for market share mounts, it will be increasingly important to consider climate risks in prioritizing their development.
Next Steps for the OCI
- In order to guide energy and climate decisionmaking, investors need to make realistic asset valuations and industry must make sound infrastructure plans. Policymakers need to condition permits, set standards, and price carbon. And the public needs information and incentives to make wise energy choices.
- The OCI can shape how these stakeholders address the climate impacts of oil, and the use of the index can foster critical public-private discussions about these issues.
- The most GHG-intensive oils currently identified—gassy oils, heavy oils, watery and depleted oils, and extreme oils—merit special attention from investors, oil-field operators, and policymakers.
- To increase transparency on a greater volume and variety of global oil resources, it will be necessary to expand the OCI. This will require more high-quality, consistent, open-source oil data. This information will facilitate the restructuring of oil development in line with climate realities.
Introduction
The character of oil is changing. Consumers may not notice the transformation—prices have fluctuated, but little else appears to have changed at the gas pump. Behind the scenes, though, the definition of oil is shifting in substantial ways. There is oil trapped tightly in shale rock, and oil pooled many miles below the oceans. Oil can be found in boreal forests, Arctic permafrost, and isolated geologic formations. Some oils are as thick as molasses or as gummy as tar, while others are solid or contain vastly more water or gas than normal.
Oil resources were once fairly homogeneous, produced using conventional means and refined into a limited number of end products by relatively simple methods. This is no longer the case. Advancements in technology mean that a wider array of hydrocarbon deposits in once-unreachable areas are now viable, extractable resources. And the techniques to turn these unconventional oils into petroleum products are becoming increasingly complex.
As oil is changing, so, too, is the global climate. The year 2014 ranked as the earth’s warmest since 1880. Fossil fuels—oil along with coal and methane gas—are the major culprits.
The only way to determine the climate impacts of these previously untapped resources—and to compare how they stack up against one another—is to assess their greenhouse gas (GHG) emissions at each stage in the oil supply chain: exploration, extraction, processing, refining, transport, and end use. The more energy it takes to carry out these processes, the greater the impact on the climate. And in the extreme case of some of these oils, it may take nearly as much energy to produce, refine, and transport them as they provide to consumers. Moreover, each oil yields a different slate of petroleum products with different combustion characteristics and climate footprints.
The Oil-Climate Index (OCI) is a metric that takes into account the total life-cycle GHG emissions of individual oils—from upstream extraction to midstream refining to downstream end use. It offers a powerful, yet user-friendly, tool that allows investors, policymakers, industry, the public, and other stakeholders to compare crudes and assess their climate consequences both before development decisions are made as well as once operations are in progress. The Oil-Climate Index will also inform oil and climate policy making.
The index highlights two central facts: The fate of the entire oil barrel is critical to understanding and designing policies that reduce a crude oil’s climate impacts. And oils’ different climate impacts are not currently identified or priced into the market value of competing crudes or their petroleum products. As such, different oils may in fact entail very different carbon risks for resource owners or developers.
. Analysis of the first 30 test oils to be modeled with the index reveals that emission differences between oils are far greater than currently acknowledged. Wide emission ranges exist whether values are calculated per barrel of crude, per megajoule of products, or per dollar value of products, and it is expected that these emission ranges could grow as new, unconventional oils are identified.
There are several critical variables that lead to these variations in oils’ life-cycle climate emissions. They include how gas trapped with the oil is handled by producers, whether significant steam is required for oil production, if a lot of water is present as the oil reservoir depletes, how heavy (viscous) or deep the oil is, what type of refinery is used, and whether bottom-of-the-barrel products like petroleum coke (known as petcoke) are combusted. Given these factors, the most climate-intensive oils currently identified—gassy oils, heavy oils, watery and depleted oils, and extreme oils—require special attention from investors, operators, and policymakers.
Expanding the index to include more global oils is necessary in order to compare greater volumes of crudes. This requires more transparent, high-quality, consistent, accessible, open-source data. As competition mounts between new oils, information about emerging resources is needed to increase market efficiency, expand choices, leverage opportunities, and address climate challenges.
Oil 2.0
Concerns about oil scarcity beset the world for nearly half a century, but that may no longer be the overriding worry. Larger questions loom about the changing nature of oil resources, their unknown characteristics, their climate and other environmental impacts, and policies to safely guide their development and use.
Indeed, there are thousands of oils available globally for production and use. The earth is stocked with a surfeit of hydrocarbons. As of 2013, there are an estimated 24 trillion barrels of oil in place, of which 6 trillion barrels are deemed technologically recoverable.
These resources take different forms—from rocky kerogen to sludgy tar to volatile gassy liquids. They exist under vastly different conditions: deep and shallow; onshore and offshore; pooled and dispersed; and in deserts, permafrost, rainforests, and grasslands. An evolving array of techniques must be employed to transform them into a myriad of petroleum products, some more valuable than others, which flow in all directions to every economic sector and most household products.
Advancements in technology that have unlocked unconventional hydrocarbon deposits in once-unreachable areas are costly and risky in both private and social terms. Many of these advancements result in larger GHG emissions than traditional extraction methods, and some oils have more than 80 % higher emissions per barrel than others (see figure 1).
Consider a few examples. For California’s Midway Sunset oil field, a sizable portion of the oil’s own energy content is used before any of the petroleum products the field ultimately provides reach consumers. This century-old oil field requires large volumes of steam to be injected into the reservoir to loosen the oil and allow it to flow. Generating this steam requires up to one-third of the energy content of the oil itself, in the form of natural gas. The water content of this oil is high and therefore takes extra energy to lift. Much of its oil is very heavy and requires energy-intensive, complex refining techniques. The combination of energy used in extraction and refining means almost half of Midway Sunset’s total greenhouse gas emissions are released before the resource even gets to market.
Other oils, such as Norway Ekofisk, fare much better in these regards. This light oil is more easily produced. Extraction operations are tightly regulated by the Norwegian government; as such, the gas produced with the oil is gathered and sold instead of burned (or flared) on-site and wasted. Ekofisk oil is processed by the simplest hydroskimming refinery, and less than 10 % of its greenhouse gases are emitted before it gets to market.
Oil markets, meanwhile, are durable given the lack of ready substitutes. Oil consumption has marched steadily upward, from 77 million barrels per day (mbd) in 2000 to 92 mbd in 2014, despite a major global economic downturn. Oil dominates the transportation sector, providing 93 % of motorized transportation energy. Overall, the oil sector is responsible for a reported 35 % of global GHG emissions.
Parsing oils by their climate impacts allows multiple stakeholders, each with their own objectives, to consider climate risks in prioritizing the development of future oils and the adoption of greater policy oversight of today’s oils. While objectives of stakeholders may vary (for example, environmental nongovernmental organizations may have different perspectives than investors), all actors would be better served by accurate, transparent measures of climate risk associated with different oils.
The Most Challenging Oils
Even with the decline in oil prices that began in August 2014, there remains fierce competition between diverse global oils. A few of them are more challenging in terms of climate change than others.
- Gassy oils: Oil fields typically have some natural gas (or methane) and other lighter gases (ethane and others) associated with them. The more gas that is present, the more challenging and costly it is to safely manage these commodities. When the gas associated with certain gassy oils is not handled properly, usually due to lack of appropriate equipment, the gas is burned or released as a waste byproduct. Both flaring and venting operations are damaging to the climate as they release carbon dioxide, methane, and other GHG emissions. Oils that resort to these practices can result in at least 75 % larger GHG footprints than comparable light oils that do not flare. Flaring policies vary. For example, it has been illegal to flare associated gas in Norway since the 1970s, making these oils some of the lowest emitting oils produced today.
- Heavy oils: The heavier the oil, the more heat, steam, and hydrogen required to extract, transport, and transform it into high-value petroleum products like gasoline and diesel. These high-carbon oils also yield higher shares of bottom-of-the-barrel products like petcoke that are often priced to sell. The heaviest oils have total GHG footprints that can be nearly twice as large as lighter oils.
- Watery and depleted oils: Depleted oil fields tend to produce significant quantities of water along with the oil. It takes a lot of energy to bring this water to the surface, process it, and reinject or dispose of it. If an oil field has a water-oil ratio of ten to one, that adds nearly 2 tons of water for every barrel of oil produced. Certain depleted oils in California’s San Joaquin Valley, for example, produced 25 or 50 barrels of water per barrel of oil. Oils with high water-oil ratios can have total GHG footprints that are more than 60 % higher than oils that are not so encumbered.
- Extreme oils: Some oils are difficult to access. For example, some oils are buried deeply below the surface, like theChayvo oil field in Russia’s Sakhalin shelf, which is reached by an incredible set of highly deviated wells that are about 7 miles long. How much energy it takes to recover such resources is highly uncertain. Still other oils are located in areas that sequester greenhouse gases like permafrost, boreal peat bogs, and rainforests. Removing these oils disrupts lands that store significant amounts of carbon, releasing substantial volumes of climate-forcing gases. GHG footprints may be significantly larger for oils that are difficult to access or located in climate-sensitive environments, and this merits further investigation.
Whether global oil production returns to record levels, wanes, or fluctuates in the future, there is little doubt that oils will be increasingly unconventional. And there is little doubt that oil extraction, refining, and consumption should be better understood. There is far too little information about the new generation of oil resources.
Creating an Oil-Climate Index
As the changing climate results in higher social costs, the environmental limitations on oil production and consumption will have more significant effects than the industry has heretofore acknowledged.1 Recent research has shown that to keep the earth from warming more than 2 degrees Celsius from preindustrial times—the limit set in the 2009 Copenhagen Accord as the threshold for “dangerous” human interference in the climate system—at least one-third of the world’s oil reserves should not be burned or the carbon from refined oil products’ combustion should be safely stored.2Investors and companies facing such constraints will need data on the total life-cycle emissions from the exploration, extraction, transportation, refining, and combustion of oil resources, data that do not now exist, at least not in a consistent, transparent, and peer-reviewed way.
The Oil-Climate Index is designed to fill that void by analyzing total GHG emissions (including all co-products) for given crudes using three different functional units, or different metrics, for comparison. The first version of the index includes: emissions per barrel of crude produced, emissions per energy content of all final petroleum products, and emissions per dollar value of all petroleum products sold.
The Oil-Climate Index uses the following open-source tools to evaluate actual emissions associated with an individual oil’s supply chain:
- OPGEE(Oil Production Greenhouse Gas Emissions Estimator), developed by Adam Brandt at Stanford University,3 evaluates upstream oil emissions from extraction to transport to the refinery inlet.
- PRELIM(Petroleum Refinery Life-Cycle Inventory Model), developed by Joule Bergerson at the University of Calgary,4 evaluates refining emissions and petroleum product yields.
- OPEM(Oil Products Emissions Module), developed by Deborah Gordon and Eugene Tan at the Carnegie Endowment for International Peace’s Energy and Climate Program and Jonathan Koomey at Stanford University’s Steyer-Taylor Center for Energy Policy and Finance, calculates the emissions that result from the transport and end use of all oil products yielded by a given crude. An overriding goal of the module is to include and thereby avoid carbon leakage from petroleum co-products.
While oil type, production specifications, and geography were initial factors in selecting oils to model in Phase 1 of the Oil-Climate Index, data availability turned out to be the overriding factor. The oils modeled in the first phase are found around the world (see table 1). Oils were analyzed across the entire value chain—the series of transformations and movements from an oil’s origin to the consumption of the slate of petroleum products it yields.
Modeling Upstream Oil Emissions
Unearthing oil and preparing it for transport to a refinery is the first step in the value chain. The processes involved differ from oil to oil. Together, exploration, production, surface processing, and transport of crude oil to the refinery inlet comprise upstream operations, and the resulting GHG emissions are modeled in OPGEE.
OPGEE Phase 1 Results
Crudes vary significantly in their upstream GHG impacts. To date, OPGEE has been run on approximately 300 global crudes, many of which are in California and Canada. This represents more upstream crude runs than any other modeling effort, including the National Energy Technology Laboratory’s Development of Baseline Data and Analysis of Life Cycle Greenhouse Gas Emissions of Petroleum-Based Fuels (twelve crudes in November 2008); the Jacobs Consultancy’s Life Cycle Assessment Comparison of North American and Imported Crudes (thirteen crudes in 2009); TIAX Consulting’s Comparison of North American and Imported Crude Oil Lifecycle GHG Emissions (nine crudes in 2009); and IHS Consulting’s Comparing GHG Intensity of the Oil Sands and the Average U.S. Crude Oil (28 crudes in 2014).
For the purposes of the Oil-Climate Index, it was critical that data were available to simultaneously model both upstream and midstream emissions. This narrowed the field down to 30 OCI test oils for the first phase.
There is large variation in upstream emissions across the 30 test oils. The oil with the highest emissions intensity has approximately twelve times the emissions of the lowest-intensity oil.