


2014 saw 30% increase in photovoltaic installations
Even as the non-residential PV sector was down 6%, 2014 was the largest year ever for solar PV installations in the US, riding on the back of a drop-off in system installed costs, downstream innovation and stable policy, according to a new report by GTM Research.
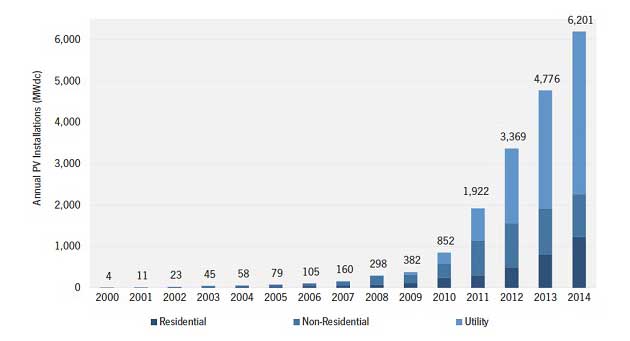
Annual US Solar PV Installations (2000-2014). Source: GTM Research/SEIA U.S….
Photovoltaic (PV) installations in the US reached 6,201 MW in 2014, up 30% from 2013, making 2014 the largest year to date for PV installations, according to a 2014 US Solar Market Insight report released in March by GTM Research and the Solar Energy Industries Association.
As it continued to grow in 2014, solar PV accounted for 32% of new generating capacity in the US, second only to natural gas (42%). At the end of the year, there was a cumulative total of 18.3 GW of solar PV and another 2.2 GW of concentrating solar power (CSP) operating in the US.
Growth was primarily driven by the utility solar PV market, which accounted for 63% of all PV capacity brought on-line in 2014 and remains the bedrock of demand within the US solar market.Overall, the utility PV sector installed 3,934 MW in 2014, a 38% increase from 2013.
This included the two 550 MW projects in California — Desert Sunlight and Topaz Solar –currently the world’s largest, which are expected to come online this year.
The residential PV segment registered the biggest annual growth, jumping by 51% from 2013, for a total of 1,231 MW of newly installed capacity.
For the second consecutive year, SolarCity and Vivint Solar were the top residential installers in the US. The two companies alone installed more than half of all residential solar deployed in the second half of 2014.
Meanwhile, the non-residential market dipped slightly for the first time in 2014. The sector installed 1,036 MW overall, down 6% from 2013.
The commercial segment has proven harder to scale as it remains much more sensitive to the volatility in state-level incentives than the residential solar market, according to Cory Honeyman, solar analyst at GTM Research and one of the co-authors of the report.
The end of 2014 was also the first time the solar PV market in the US saw glimpses of geographic diversification, even though California again had the most solar PV installations in 2014, with 3,549 MW, nearly 1,000 MW more than in 2013.
Falling costs across all segments and states
While PV module prices remained relatively flat in 2014, balance-of-systems prices fell precipitously, leading to an average 10% annual decline in system prices, depending on the market segment.
According to the GTM research report, total installation costs for utility and large commercial systems have fallen below US$2/W and are now below 2011 module costs. The cost for a medium-scale commercial system averaged US$2.25/W at the end of 2014.
The report notes significant variance in system pricing in the utility-scale segment, ranging from as high as US$2.10/W to as low as US$1.40/W. Because of the enormous size of its projects, the utility-scale segment sees system prices that are nearly US$2/W cheaper than the residential solar PV sector.
According to the study, there is ample opportunity to lower system costs further, especially by optimizing soft costs – such as customer acquisition, labor and permitting – which make up on average 60% of overall system prices. There is also a lot of potential for cost of financing innovations such as YieldCos and further reductions in balance-of-system prices.
Most large clean energy developers have already launched or are getting ready to launch a YieldCo to fund their growth plans and raise cash. The current lineup includes Pattern Renewable Energy Partners, NRG Yield, NextEra Energy Partners, Abengoa Yield, TerraForm Power and TransAlta Renewables.
Most recently, the thin film company First Solar and c-Si manufacturer SunPower announced in February that they are planning the IPO of a YieldCo to own PV farms.
Soft costs have been one of the major bottlenecks in the commercial PV market, in particular.
“There has been a bigger need for non-residential market lately to focus on opportunities to lower soft costs and that specifically lies in what has had some pretty sluggish efforts towards customer origination and standardizing the actual risk analysis for individual projects to lower some of the transaction costs that come with developing individual commercial solar projects,” Honeyman says.
Effect of natural gas prices on procurement strategies
The volatility of natural gas prices in 2014 has also had a material impact on the recent procurement strategies of utilities, especially in the US Southwest, according to Honeyman.
“There are a lot of utilities that have taken a proactive approach over the past 12 months to procure utility-scale solar as a hedge against expectations surrounding what future pricing will be for natural gas,” Honeyman says.
“Whether that means just as a pure hedge to have a competitive alternative or, under a more optimistic view, that solar will actually be a lower-priced option than some of the natural gas alternatives.”
Most recently, in November 2014, Arizona utility Salt River Project (SRP) agreed to procure 45 MW of utility-scale solar from Utah-based developer sPower for a price that rivals power costs from traditional natural gas plants.
The 21-year power purchase deal with the solar plant in Florence, Arizona will average 5.3 cents/KWh. Currently, SRP buys wholesale power at an average rate of around 4 cents/KWh.
SRP expects that in a few years the cost of natural gas will cross over the price that was set for the Florence project, making the solar plant fairly economically competitive.
“2014 was a pretty big transition for the utility-scale market in that a growing number of projects were now being procured based on their respective economic competitiveness with natural gas alternatives,” Honeyman says.
“This logic of integrating solar as a purely economically competitive generation resource, primarily driven to meet an RPS standard, is a pretty new wave of procurement that’s happening on a consistent basis. Collectively, there is now more than 4 GW worth of utility-scale solar projects that were procured for reasons other than meeting the [Renewable Portfolio Standards].”
2015 market outlook
The GTM Research report predicts that 2015 will be another growth year for solar PV across all segments in the US, but it will be most rapid for the residential sector. Total PV installations are expected to reach 8.1 GW in the US 2015, or up 31% over 2014.
With more than 14 GW of utility-scale solar projects in the US with power purchase agreements in place and expected completion dates of 2015 or 2016, the utility-scale solar sector will remain the largest in terms of annual capacity additions, accounting for about 59% of all installations brought on-line in 2015.
This segment is seeing more tax-equity-motivated investors that are trying to bring as much capacity online as possible before the scheduled step-down of the 30% federal investment tax credit (ITC), which is slated to drop to 10% for commercial projects on January 1, 2017.
According to Honeyman, 2015 will also be a litmus test for the commercial solar PV market in the US. Many market players expect a pickup in demand in key states, including California, New Jersey and New York, which could reignite the sector and bring it back on a par with the residential market.
“When you think about the challenges that the US solar market is facing, you can sort of break it out into – what is expected to happen in the next couple of years before the ITC is scheduled to drop and then thinking about the post-2016 landscape and the challenges that lay there,” Honeyman says. – PV Insider